Flot Charts
Flot is a pure JavaScript plotting library for jQuery, with a focus on simple usage, attractive looks and interactive features.
Flot charts itself a combination of multiple flot libraries and it's recommended to load all the related javascript libraries in the web page in order to render complete, flawless and responsive charts.
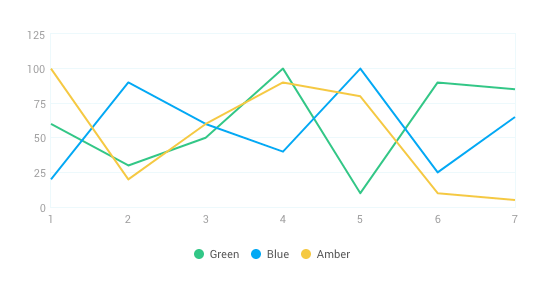
Page Demo Plugin WebsiteBasic line chart
<div class="flot-chart flot-line"></div>
<div class="flot-chart-legends flot-chart-legends--line"></div>
// Chart Data
var lineChartData = [
{
label: 'Green',
data: [[1,60], [2,30], [3,50], [4,100], [5,10], [6,90], [7,85]],
color: '#32c787'
},
{
label: 'Blue',
data: [[1,20], [2,90], [3,60], [4,40], [5,100], [6,25], [7,65]],
color: '#03A9F4'
},
{
label: 'Amber',
data: [[1,100], [2,20], [3,60], [4,90], [5,80], [6,10], [7,5]],
color: '#f5c942'
}
];
// Chart Options
var lineChartOptions = {
series: {
lines: {
show: true,
barWidth: 0.05,
fill: 0
}
},
shadowSize: 0.1,
grid : {
borderWidth: 1,
borderColor: '#edf9fc',
show : true,
hoverable : true,
clickable : true
},
yaxis: {
tickColor: '#edf9fc',
tickDecimals: 0,
font :{
lineHeight: 13,
style: 'normal',
color: '#9f9f9f',
},
shadowSize: 0
},
xaxis: {
tickColor: '#fff',
tickDecimals: 0,
font :{
lineHeight: 13,
style: 'normal',
color: '#9f9f9f'
},
shadowSize: 0,
},
legend:{
container: '.flot-chart-legends--line',
backgroundOpacity: 0.5,
noColumns: 0,
backgroundColor: '#fff',
lineWidth: 0,
labelBoxBorderColor: '#fff'
}
};
// Create chart
if ($('.flot-line')[0]) {
$.plot($('.flot-line'), lineChartData, lineChartOptions);
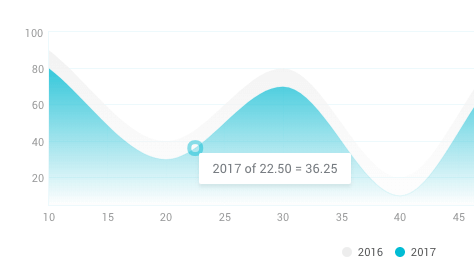
}Line chart with curved edges
Curved lines in flot made possible with plugin https://github.com/MichaelZinsmaier/CurvedLines
CurvedLines is a plugin for flot, which displays lines in a smooth curved way. This is achieved by adding additional points in between the "real" data points.
<script src="vendors/bower_components/flot.curvedlines/curvedLines.js"></script> 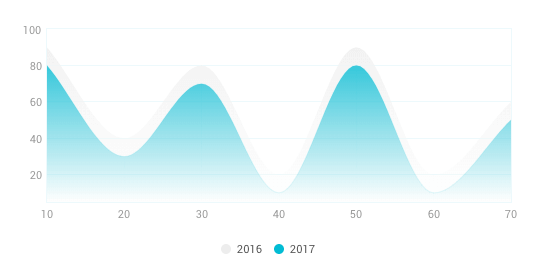
<div class="flot-chart flot-curved-line"></div>
<div class="flot-chart-legends flot-chart-legends--curved"></div>
// Chart Data
var curvedLineChartData = [
{
label: '2016',
color: '#ededed',
lines: {
show: true,
lineWidth: 0,
fill: 1,
fillColor: {
colors: ['rgba(246,246,246,0.1)', '#f1f1f1']
}
},
data: [[10, 90], [20, 40], [30, 80], [40, 20], [50, 90], [60, 20], [70, 60]],
},
{
label: '2017',
color: '#00BCD4',
lines: {
show: true,
lineWidth: 0.1,
fill: 1,
fillColor: {
colors: ['rgba(0,188,212,0.001)', '#00BCD4']
}
},
data: [[10, 80], [20, 30], [30, 70], [40, 10], [50, 80], [60, 10], [70, 50]]
}
];
// Chart Options
var curvedLineChartOptions = {
series: {
shadowSize: 0,
curvedLines: {
apply: true,
active: true,
monotonicFit: true
},
points: {
show: false
}
},
grid: {
borderWidth: 1,
borderColor: '#edf9fc',
show: true,
hoverable: true,
clickable: true
},
xaxis: {
tickColor: '#fff',
tickDecimals: 0,
font: {
lineHeight: 13,
style: 'normal',
color: '#999999',
size: 11
}
},
yaxis: {
tickColor: '#edf9fc',
font: {
lineHeight: 13,
style: 'normal',
color: '#999999',
size: 11
},
min: +5
},
legend:{
container: '.flot-chart-legends--curved',
backgroundOpacity: 0.5,
noColumns: 0,
backgroundColor: '#fff',
lineWidth: 0,
labelBoxBorderColor: '#fff'
}
};
// Create charts
if ($('.flot-curved-line')[0]) {
$.plot($('.flot-curved-line'), curvedLineChartData, curvedLineChartOptions);
}
Bar Chart
flot-orderBars plugin is used in the below example in order to show the bars side by side.
Include flot-orderBars javascript asset file:
<script src="vendors/bower_components/flot-orderBars/js/jquery.flot.orderBars.js"></script>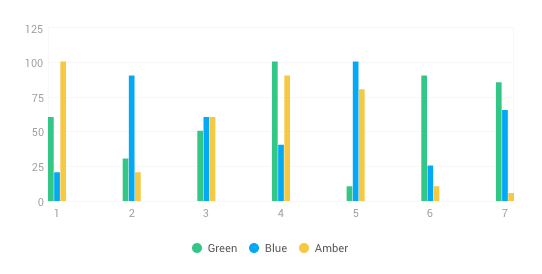
<div class="flot-chart flot-bar"></div>
<div class="flot-chart-legends flot-chart-legends--bar"></div>
// Chart Data
var barChartData = [
{
label: 'Green',
data: [[1,60], [2,30], [3,50], [4,100], [5,10], [6,90], [7,85]],
color: '#32c787',
bars: {
order: 0
}
},
{
label: 'Blue',
data: [[1,20], [2,90], [3,60], [4,40], [5,100], [6,25], [7,65]],
color: '#03A9F4',
bars: {
order: 1
}
},
{
label: 'Amber',
data: [[1,100], [2,20], [3,60], [4,90], [5,80], [6,10], [7,5]],
color: '#f5c942',
bars: {
order: 2
}
}
];
// Chart Options
var barChartOptions = {
series: {
bars: {
show: true,
barWidth: 0.05,
fill: 1
}
},
grid : {
borderWidth: 1,
borderColor: '#f8f8f8',
show : true,
hoverable : true,
clickable : true
},
yaxis: {
tickColor: '#f8f8f8',
tickDecimals: 0,
font :{
lineHeight: 13,
style: "normal",
color: "#9f9f9f",
},
shadowSize: 0
},
xaxis: {
tickColor: '#fff',
tickDecimals: 0,
font :{
lineHeight: 13,
style: "normal",
color: "#9f9f9f"
},
shadowSize: 0,
},
legend:{
container: '.flot-chart-legends--bar',
backgroundOpacity: 0.5,
noColumns: 0,
backgroundColor: '#fff',
lineWidth: 0,
labelBoxBorderColor: '#fff'
}
};
// Create chart
if ($('.flot-bar')[0]) {
$.plot($('.flot-bar'), barChartData, barChartOptions);
}Pie Chart
Include Flot Pie chart library:
<script src="vendors/bower_components/flot/jquery.flot.pie.js"></script>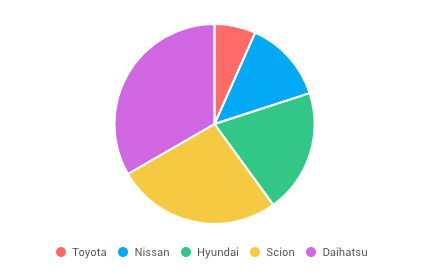
<div class="flot-chart flot-pie"></div>
<div class="flot-chart-legends flot-chart-legend--pie"></div>
// Make some sample data
var pieData = [
{data: 1, color: '#ff6b68', label: 'Toyota'},
{data: 2, color: '#03A9F4', label: 'Nissan'},
{data: 3, color: '#32c787', label: 'Hyundai'},
{data: 4, color: '#f5c942', label: 'Scion'},
{data: 5, color: '#d066e2', label: 'Daihatsu'}
];
// Pie Chart
if($('.flot-pie')[0]){
$.plot('.flot-pie', pieData, {
series: {
pie: {
show: true,
stroke: {
width: 2
}
}
},
legend: {
container: '.flot-chart-legend--pie',
backgroundOpacity: 0.5,
noColumns: 0,
backgroundColor: "white",
lineWidth: 0,
labelBoxBorderColor: '#fff'
}
});
}Donut Chart
Include Flot Pie chart library:
<script src="vendors/bower_components/flot/jquery.flot.pie.js"></script>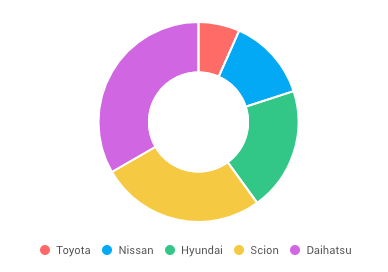
<div class="flot-chart flot-donut"></div>
<div class="flot-chart-legends flot-chart-legend--donut"></div>
// Make some sample data
var pieData = [
{data: 1, color: '#ff6b68', label: 'Toyota'},
{data: 2, color: '#03A9F4', label: 'Nissan'},
{data: 3, color: '#32c787', label: 'Hyundai'},
{data: 4, color: '#f5c942', label: 'Scion'},
{data: 5, color: '#d066e2', label: 'Daihatsu'}
];
// Donut Chart
if($('.flot-donut')[0]){
$.plot('.flot-donut', pieData, {
series: {
pie: {
innerRadius: 0.5,
show: true,
stroke: {
width: 2
}
}
},
legend: {
container: '.flot-chart-legend--donut',
backgroundOpacity: 0.5,
noColumns: 0,
backgroundColor: "white",
lineWidth: 0,
labelBoxBorderColor: '#fff'
}
});
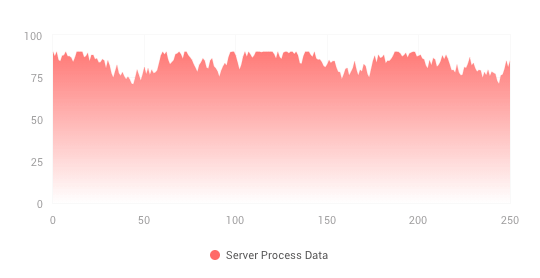
}Dynamic Line Chart
Continues dynamic data chart based on Flot line.
<div class="flot-chart flot-dynamic"></div>
<div class="flot-chart-legends flot-chart-legends--dynamic"></div>
// Chart Data
var data = [];
var totalPoints = 300;
function dynamicChartData() {
if (data.length > 0)
data = data.slice(1);
while (data.length < totalPoints) {
var prev = data.length > 0 ? data[data.length - 1] : 50,
y = prev + Math.random() * 10 - 5;
if (y < 0) {
y = 0;
} else if (y > 90) {
y = 90;
}
data.push(y);
}
var res = [];
for (var i = 0; i < data.length; ++i) {
res.push([i, data[i]])
}
return res;
}
// Chart Options
var dynamicChartOptions = {
series: {
label: "Server Process Data",
color: '#ff6b68',
lines: {
show: true,
lineWidth: 0.2,
fill: 0.6,
fillColor: {
colors: ['rgba(255,255,255,255)', '#ff6b68']
}
},
shadowSize: 0
},
yaxis: {
min: 0,
max: 100,
tickColor: '#f8f8f8',
font :{
lineHeight: 13,
style: "normal",
color: "#9f9f9f"
},
shadowSize: 0
},
xaxis: {
tickColor: '#f8f8f8',
show: true,
font :{
lineHeight: 13,
style: "normal",
color: "#9f9f9f"
},
shadowSize: 0,
min: 0,
max: 250
},
grid: {
borderWidth: 1,
borderColor: '#f8f8f8',
labelMargin:10,
hoverable: true,
clickable: true,
mouseActiveRadius:6
},
legend:{
container: '.flot-chart-legends--dynamic',
backgroundOpacity: 0.5,
noColumns: 0,
backgroundColor: '#fff',
lineWidth: 0,
labelBoxBorderColor: '#fff'
}
};
// Create Chart
if ($('.flot-dynamic')[0]) {
var plot = $.plot('.flot-dynamic', [ dynamicChartData() ], dynamicChartOptions);
}
// Update function
var updateInterval = 30;
function chartUpdate() {
plot.setData([dynamicChartData()]);
// Since the axes don't change, we don't need to call plot.setupGrid()
plot.draw();
setTimeout(chartUpdate, updateInterval);
}
chartUpdate();Chart Tooltips
Make sure to include the following function (once) in order to enable tooltips on the chart data.
if ($('.flot-chart')[0]) {
    $('.flot-chart').bind('plothover', function (event, pos, item) {
        if (item) {
            var x = item.datapoint[0].toFixed(2),
                y = item.datapoint[1].toFixed(2);
            $('.flot-tooltip').html(item.series.label + ' of ' + x + ' = ' + y).css({top: item.pageY+5, left: item.pageX+5}).show();
        }
        else {
            $('.flot-tooltip').hide();
        }
    });

    $('<div class="flot-tooltip"></div>').appendTo('body');
}
Requirements:
/scss/inc/vendor-overrides/_flot.scss/vendors/flot/jquery.flot.js/vendors/flot/jquery.flot.pie.js/vendors/flot/jquery.flot.resize.js/vendors/flot.curvedlines/curvedLines.js/vendors/flot.orderbars/jquery.flot.orderBars.js